
When your forecasting system tells you “expect 500 units of demand next week,” it sounds precise and actionable. But that single number hides something critical: how confident should you actually be? Could actual demand be 450? Or 600? Or anywhere in between?
This is the fundamental problem with point forecasts. As Professor Chris Chatfield of the University of Bath noted in his research: single-number predictions “give no guidance as to their likely accuracy” and may imply “spurious accuracy”[3]. Decision-makers receive a number that looks precise but provides no indication of the range of outcomes they should prepare for.
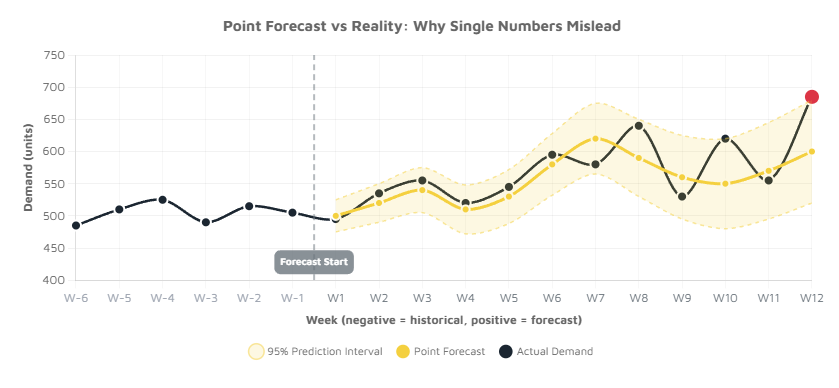
Figure 1: Historical data (gray weeks) feeds into forecasts. Notice how prediction intervals widen further into the future - and how the red outlier in W12 falls outside the expected range.
Why Uncertainty Is Unavoidable in Forecasting
Rob Hyndman identifies multiple sources of uncertainty that affect every forecast[1]: random variation in the data itself, uncertainty in the model’s parameters, uncertainty about whether we’ve chosen the right model, and perhaps most importantly - uncertainty about whether future patterns will resemble the past at all.
Most forecasting tools only account for the first source (random variation), which is why their “95% confidence” intervals often miss the target 15-30% of the time. The other sources of uncertainty simply aren’t factored in.
This isn’t a failure of forecasting - it’s the nature of predicting the future. The solution isn’t to pretend uncertainty doesn’t exist, but to quantify it and plan accordingly.
How Businesses Use Prediction Intervals
Prediction intervals transform forecasting from “here’s what will happen” to “here’s the range of what might happen.” This shift enables several practical business applications:
- Inventory planning: Instead of stocking for a single expected demand, you can set safety stock based on the upper bound of your interval to achieve your target service level
- Risk assessment: Wide intervals signal that you should prepare contingency plans; narrow intervals indicate more confidence
- Resource allocation: Staff and budget planning can account for best-case and worst-case scenarios
- Scenario planning: Intervals naturally support “what-if” analysis using the lower and upper bounds
Companies implementing probabilistic forecasting report significant improvements. Optical manufacturer Shamir achieved a 25% reduction in inventory costs while improving service levels to over 99%[2]. The key was setting different confidence levels for different product categories based on their importance and variability.
What Wide and Narrow Intervals Tell You
The width of a prediction interval reveals something important - but it’s not about your model’s quality. It’s about how predictable the time series itself is.
✓ Narrow Intervals
What it means: The underlying data has strong, consistent patterns. The future is relatively predictable.
Business implication: You can plan with more confidence. Tighter inventory levels and more precise commitments are reasonable.
Example: Weekly grocery staples with stable, seasonal demand
⚠ Wide Intervals
What it means: The data contains high variability or weak patterns. The future is inherently uncertain.
Business implication: Build in more buffer. Plan for multiple scenarios. Don’t make rigid commitments.
Example: New product launches, fashion items, or markets affected by external shocks
This is a crucial insight: wide intervals aren’t a sign of a bad model - they’re honest reporting about a volatile situation. Even the best possible model cannot make an unpredictable time series predictable. The width reflects reality, not model failure.
Time Series Predictability: What Makes Forecasting Easier or Harder?
Some business metrics are simply easier to forecast than others. Hyndman identifies several factors that make time series more predictable[4]:
- You understand the factors that contribute to its variation: Clear trend and recurring patterns (seasonality) give models something reliable to work with. Learn more about trend, seasonal patterns and variance in our time series blog.
- The forecasts cannot affect the thing you are trying to forecast
- Low noise: When random fluctuations are small relative to the signal, predictions become more reliable
- Consistent history: If the future resembles the past, historical patterns provide valuable guidance
- Abundant data: More observations help models distinguish real patterns from random noise
When these conditions aren’t met - high volatility, structural breaks, limited history - prediction intervals naturally widen to reflect the genuine uncertainty. This is valuable information: it tells you where to focus improvement efforts and where to build in operational flexibility.
Conformal Prediction: Reliable Intervals Without Assumptions
Traditional prediction intervals rely on assumptions about how your data behaves - often assuming errors follow a normal distribution. When those assumptions don’t hold (and they frequently don’t in real business data), the intervals become unreliable.
Conformal prediction takes a different approach. Instead of assuming a distribution, it learns directly from your model’s past mistakes[5]. If your model has historically been off by ±50 units about 95% of the time, conformal prediction uses that information to build intervals that will actually contain 95% of future outcomes.
The practical advantages for business users are significant:
- Works with any forecasting model: You don’t need to change your existing approach - conformal intervals can wrap around any point forecast
- Delivers what it promises: A 95% interval actually contains the true value 95% of the time, not 80% or 70%
- Adapts to your data: No assumptions about distributions - the method learns from your specific patterns
- Adjusts to changing conditions: Modern adaptive methods widen intervals when volatility increases and narrow them when things stabilize[6]
Conformal Intervals in QuantixAI
At QuantixAI, we implement conformal prediction intervals across all our forecasting outputs. Users can define their desired confidence level based on their risk tolerance and use case. The intervals automatically adjust to reflect the true predictability of each time series - wider for volatile products, narrower for stable ones.
This means you can trust that when we show a 95% prediction interval, it will actually contain the true outcome 95% of the time - not the 71-87% that traditional methods often deliver.
Get Honest Forecasts with QuantixAI
Stop planning with false precision. Our conformal prediction intervals show you the real range of possibilities so you can make better decisions.
Start Free TrialConclusion
Point forecasts create a dangerous illusion of certainty. When your system says “expect 500 units,” it’s hiding the reality that actual demand might fall anywhere in a range - and understanding that range is essential for good business decisions.
Prediction intervals solve this problem by showing you the full picture. Wide intervals tell you to prepare for volatility; narrow intervals signal confidence. Neither is inherently better - both are honest assessments of what the data actually supports.
The business case is clear: companies using probabilistic forecasting achieve 15-25% inventory cost reductions while improving service levels. The key insight is simple but powerful - quantifying what we don’t know enables better decisions than pretending we know more than we do.
References
- Hyndman, R. J. (2014). Prediction intervals too narrow. Rob J Hyndman Blog. https://robjhyndman.com/hyndsight/narrow-pi/
- ToolsGroup. (2025). Advanced Supply Chain Planning with Probabilistic Forecasting. https://www.toolsgroup.com/blog/advanced-supply-chain-planning-probabilistic-forecasting/
- Chatfield, C. (1998). Prediction Intervals for Time-Series Forecasting. In J. S. Armstrong (Ed.), Principles of Forecasting: A Handbook for Researchers and Practitioners. Springer. https://people.bath.ac.uk/mascc/PIs_paper.pdf
- SAS Blogs. (2021). Hyndman’s 5 Conditions for Easy Forecasting. https://blogs.sas.com/content/forecasting/2021/08/10/hyndmans-5-conditions-for-easy-forecasting/
- Nixtla. (2024). Conformal Prediction Tutorial. https://nixtlaverse.nixtla.io/statsforecast/docs/tutorials/conformalprediction.html
- Zaffran, M., Féron, O., Goude, Y., Josse, J., & Dieuleveut, A. (2022). Adaptive Conformal Predictions for Time Series. Proceedings of the 39th International Conference on Machine Learning (ICML). https://proceedings.mlr.press/v162/zaffran22a.html